Ethereum (ETH) has been making significant waves in the cryptocurrency market, touching levels that bring excitement to both seasoned traders and newcomers.
As of July 27, 2025, Ethereum is trading at $3,852.98 continuing to build momentum after a substantial price recovery earlier this year. With the 15-minute, 1-hour, and 1-day charts showing mixed signals, traders are left pondering the potential trajectory. Could Ethereum push past the current resistance and aim for all-time highs near $4,866, or do current indicators warn of an upcoming pullback?
15-Minute Chart Insight: Short-Term Consolidation and Immediate Volatility
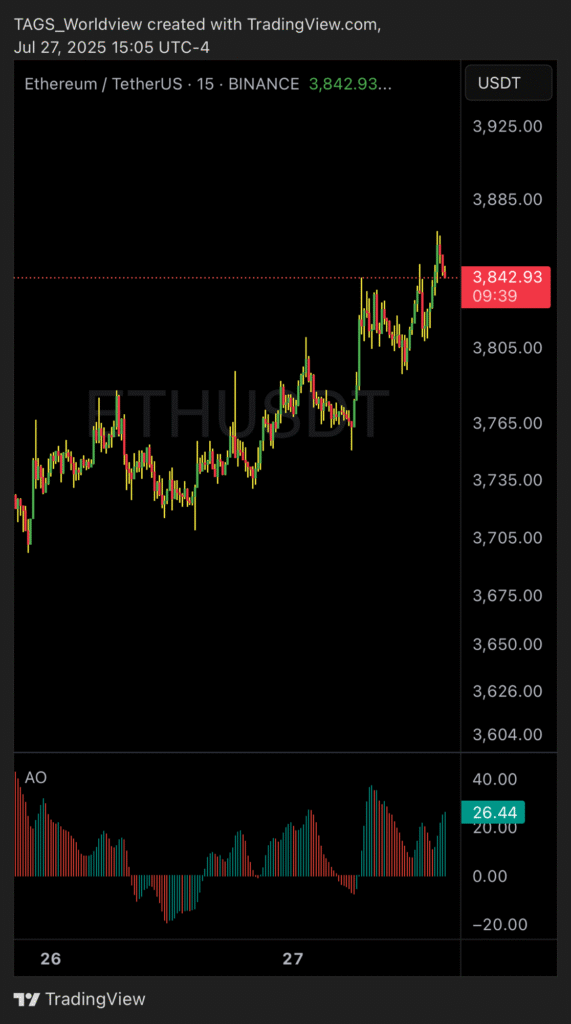
The 15-minute chart offers a granular perspective of Ethereum’s immediate price movement. Currently, the price is fluctuating close to $3,855 with tight consolidations around minor resistance levels. The Awesome Oscillator (AO) on this timeframe registers a weakening of bullish momentum as the histogram bars are retreating toward the zero line, signaling decreased buying pressure in the short-term.

For intraday traders, this indicates potential reversals or slower price movements, especially as the short-term volatility subsides. While a breakout is unlikely on this timeframe, traders should watch for further weakening in momentum, as it could precede an entry below support levels near $3,800.
1-Hour Chart Perspective: Are Bulls Losing Steam?
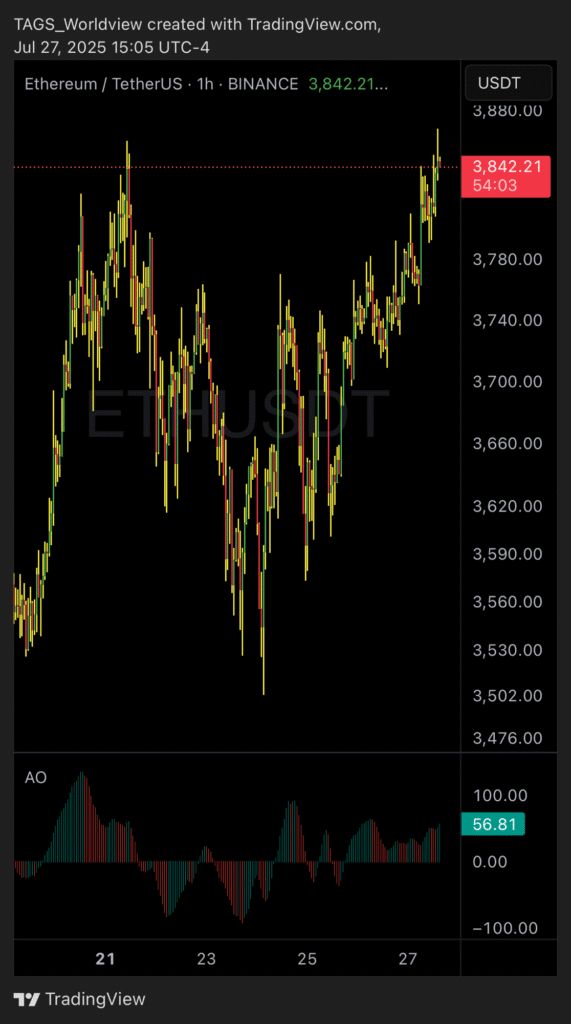
The 1-hour Ethereum chart provides a broader view of price activity, and here, we can see strong bullish tendencies during the past 48 hours as Ethereum tested the $3,850-$3,900 range multiple times. However, the Awesome Oscillator is showing early signs of bearish divergence.

The downward trend in AO bars is occurring simultaneously with Ethereum pushing into overbought territory based on other oscillators like RSI (Relative Strength Index). Despite this, Ethereum is working hard to sustain upward pressure, driven by strong exchange volume.
For swing traders, the 1-hour chart illustrates the potential for short-term corrections. If volume fails to pick up and momentum indicators continue their bearish divergence, Ethereum could pull back to retest immediate support at $3,750 or $3,700.
1-Day Chart: Testing Resistance and Eyeing All-Time Highs
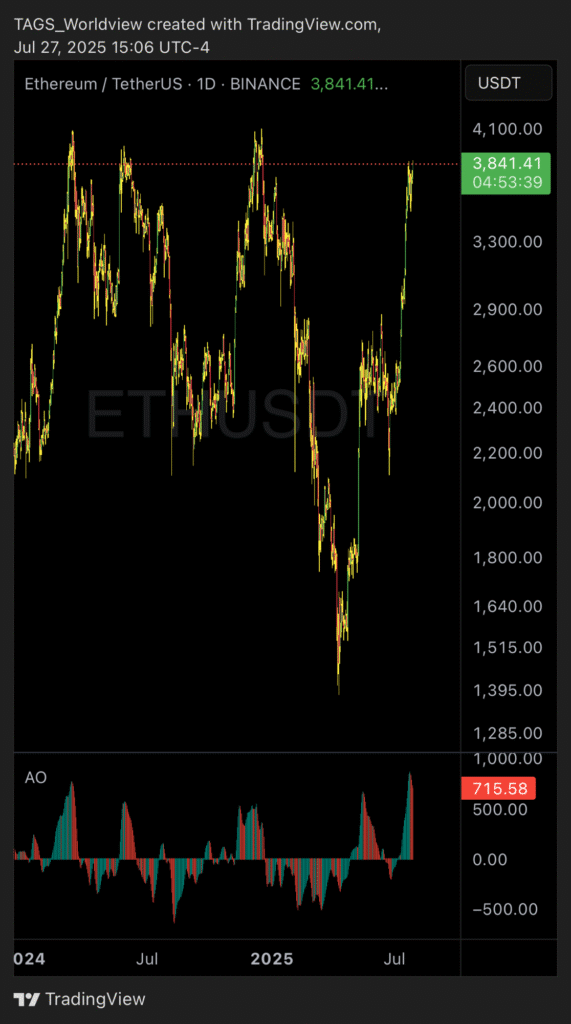
Zooming out to the 1-day chart, the picture becomes much clearer. Ethereum is just a stone’s throw away from breaking the psychological resistance level of $3,900. The medium-term trajectory has been broadly bullish, fueled by strong spot ETF inflows and increased accumulation addresses grabbing ETH coins, as highlighted in recent market data.

However, the Awesome Oscillator reveals important bearish signals. With histogram bars shrinking after their previous peak, Ethereum may experience temporary weakness as sellers attempt to dominate exchange activity. While this could invite a minor pullback, any correction would likely be viewed as an opportunity for buyers to re-enter, especially given Ethereum’s bullish fundamentals.
News Catalysts Driving Price Momentum
Ethereum’s recent price action has been fueled by key events in the crypto landscape:
- Spot ETF Inflows: Ethereum has seen significant attention following Bloomberg analysts forecasting multiple cryptocurrency ETFs launches in 2025, with Ethereum included. This institutional interest adds bullish sentiment to the asset.
- Accumulation Activity: According to FXStreet, over 1.11 million ETH have been accumulated in key investor addresses in the past week, signaling long-term confidence.
- Technical Innovations: Continued updates in Ethereum’s DeFi applications and staking strategies are attracting new investors, further reinforcing bullish sentiment.
Despite these bullish drivers, the market remains sensitive to overbought conditions indicated by the RSI and Awesome Oscillator.
Where Is Ethereum Headed?
Ethereum is at a critical juncture. Breakouts above $3,900 will likely position Ethereum to target $4,000 and potentially retest all-time highs near$ 4,866. However, the bearish divergence in short-term charts suggests caution. Traders should anticipate potential pullbacks to $3,750 or lower before Ethereum regains momentum for its next leg up.
Are you ready to dive deeper into the world of trading and catch profitable moves before they become obvious? Join Sharks Frenzy, the ultimate community for traders of all levels. Engage in live discussions with experienced traders, learn technical analysis strategies, and stay updated on the latest in Ethereum and other digital assets.
